1. Introduction
In this case study, we’ll look at what wash trading looks like on the blockchain by studying the NEXF token.
The NEXF token was part of a sting operation conducted by the U.S. Federal Bureau of Investigation (FBI), which ensnared market makers providing wash trading services for a fee.
By combining various measures, including the use of log scales, the number of unique senders of the token, and the sum of transfer amounts, we look at how detecting wash trading on the blockchain is possible.
The NEXF token wash trading case study is an ideal scenario because we know for a fact that almost all the transaction activity was from wash trading.
This enables us to understand which measures are best applied to enable wash trading activity to stand out, and what specific dimensions should be monitored when analyzing blockchain transactions to detect wash trading.
2. NEXF – The FBI Token
2.1 What is NEXF?
As part of an investigation into crypto-asset price manipulation, the FBI created a token on the Ethereum blockchain network called NexFundAI or NEXF as part of Operation Token Mirrors.
Ostensibly NexFundAI was a way to invest in early-stage artificial intelligence projects.
Federal agents posing as promoters of the NexFundAI sought out various “market makers” who would facilitate wash trading of the NEXF token for a fee, using bots and algorithms.
While not all “market makers” engage in such manipulative activity, the practice is not uncommon in the crypto-asset space.
Typically, a token promoter will approach such “market makers” to wash trade their tokens for a fee. The token promoter will provide the “market maker” with their tokens and the “market maker” will facilitate trading of the token between its addresses to create the impression that a token is actively traded, thereby luring retail investors to buy the token, while allowing insiders to sell.
2.2 What does wash trading look like in practice?
Although wash trading is common in crypto-asset markets, identifying such patterns is especially challenging in decentralized markets because it is trivial to set up fresh wallet addresses.
New wallet addresses trading an increasing number of tokens can create the mistaken belief in the existence of an organic market for tokens where none exists.
This is why analyzing token volume alone is insufficient to reveal wash trading activity on decentralized blockchain networks and other metrics, such as the number of “Unique From Addresses” is needed.
We know that the NEXF token was wash-traded by the “market makers” the FBI had appointed, and this is clear from the transaction behavior in Figure 1.
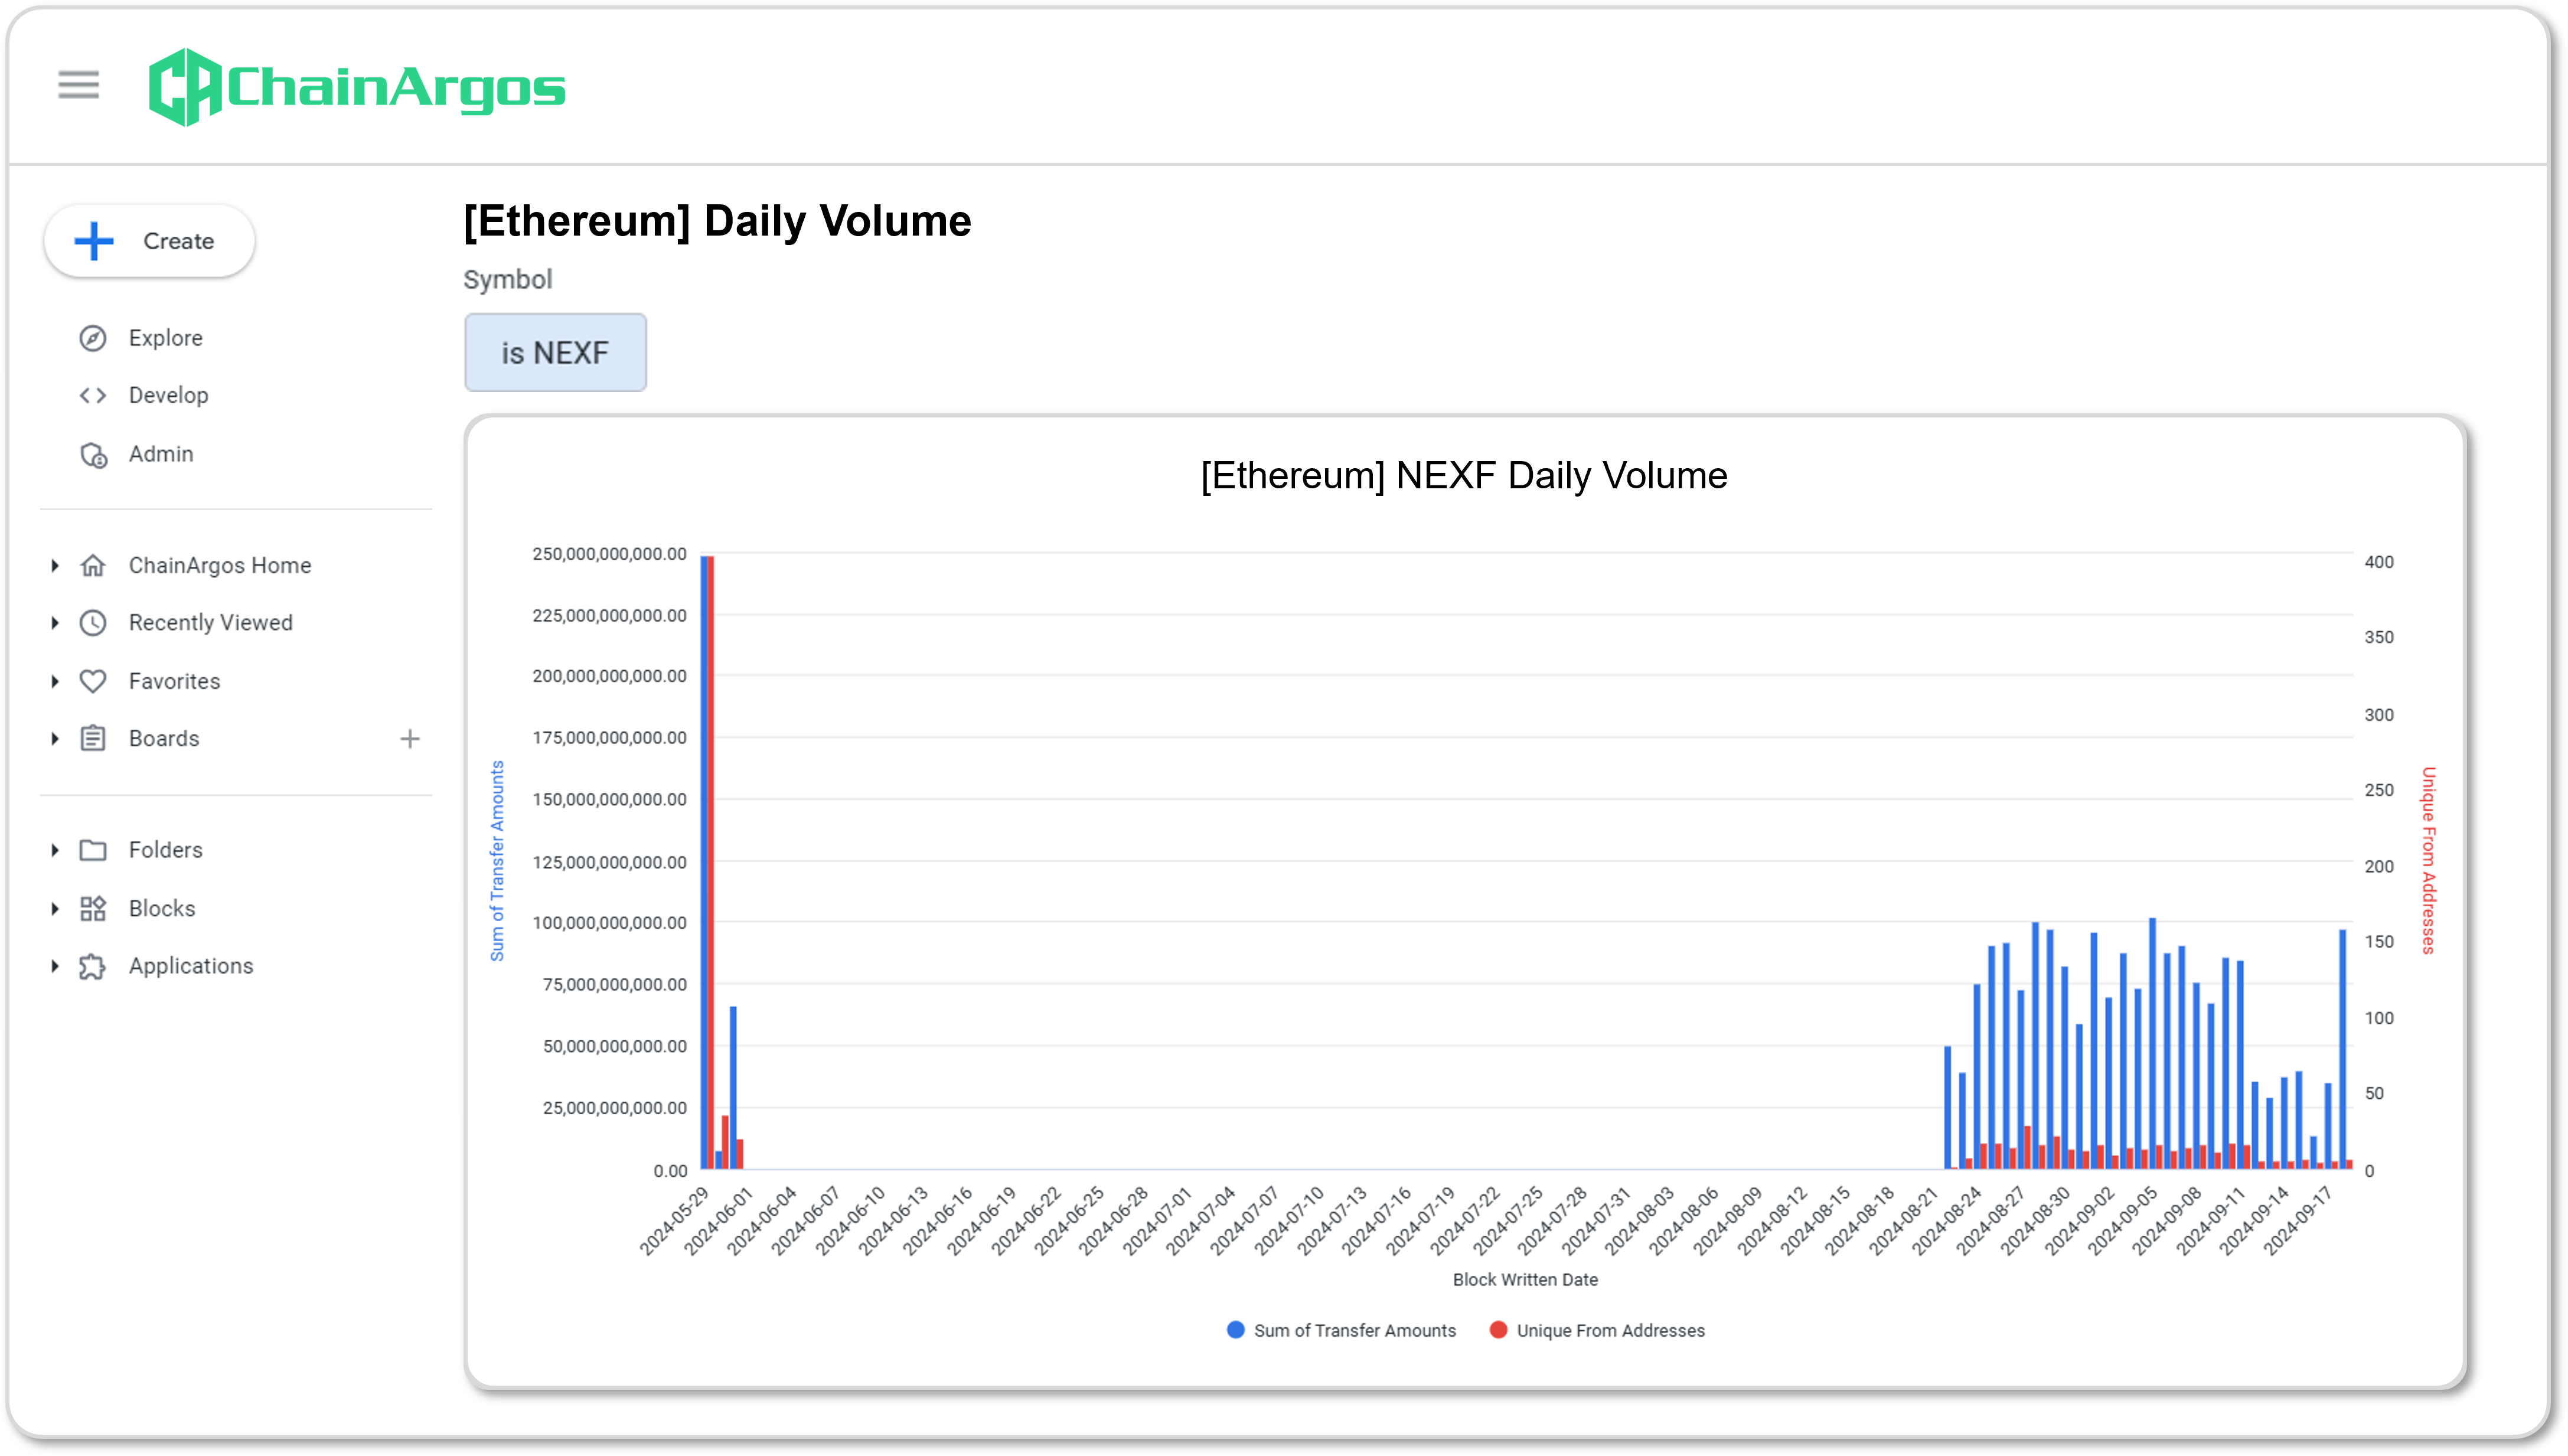
Figure 1. NEXF Daily Volume with Sum of Transfer Amounts (in blue) and the Unique From Addresses (in red).
Figure 1. shows the Sum of Transfer Amounts (the blue bars), which is the number of tokens sent, with their amounts on the left vertical axis.
Unique From Addresses (the red bars) are the number of unique addresses sending the NEXF tokens, with their amounts on the right vertical axis.
As seen from Figure 1., there was an initial flurry of activity on May 29, 2024, which could possibly have been an initial token allocation, or testing of some sort.
This is followed by a period where no activity is observed, presumably as the FBI went looking for “market makers” willing to engage in wash trading activity as part of the FBI’s Operation Token Mirrors.
Transaction activity kicked off again around August 22, 2024 and this is where we observe what wash trading looks like on the blockchain.
Notice that while the Sum of Transfer Amounts varies slightly, it never meaningfully exceeds 100 billion tokens after the “market making” activity begins (the blue bars on the right side of Figure 1.).
Now look at the Unique From Addresses (the red bars) on the right side of Figure 1. and notice how the number of Unique From Addresses never exceeds 30, with the highest being 28 on August 27, 2024.
This transaction behavior, made obvious when using a combination of the Sum of Transfer Amounts and the number of Unique From Addresses, is consistent with a handful of “fresh” wallet addresses being created every day and wash trading roughly the same number of tokens.
So-called “market making” contracts often stipulate the volume that the “market maker” commits to creating for a customer, and this “commitment” can be seen in Figure 1.
Although an infinite number of “fresh” wallet addresses could in theory be created by a “market maker,” in practice, “market makers” prefer to keep this to a manageable number.
2.3 A Log Scale Makes Wash Trading More Obvious
Wash trading becomes even more obvious when we place the number of addresses sending out the NEXF token on the horizontal axis (From Address) and the Sum of Transfer Amounts on the vertical axis on a log scale as shown in Figure 2.
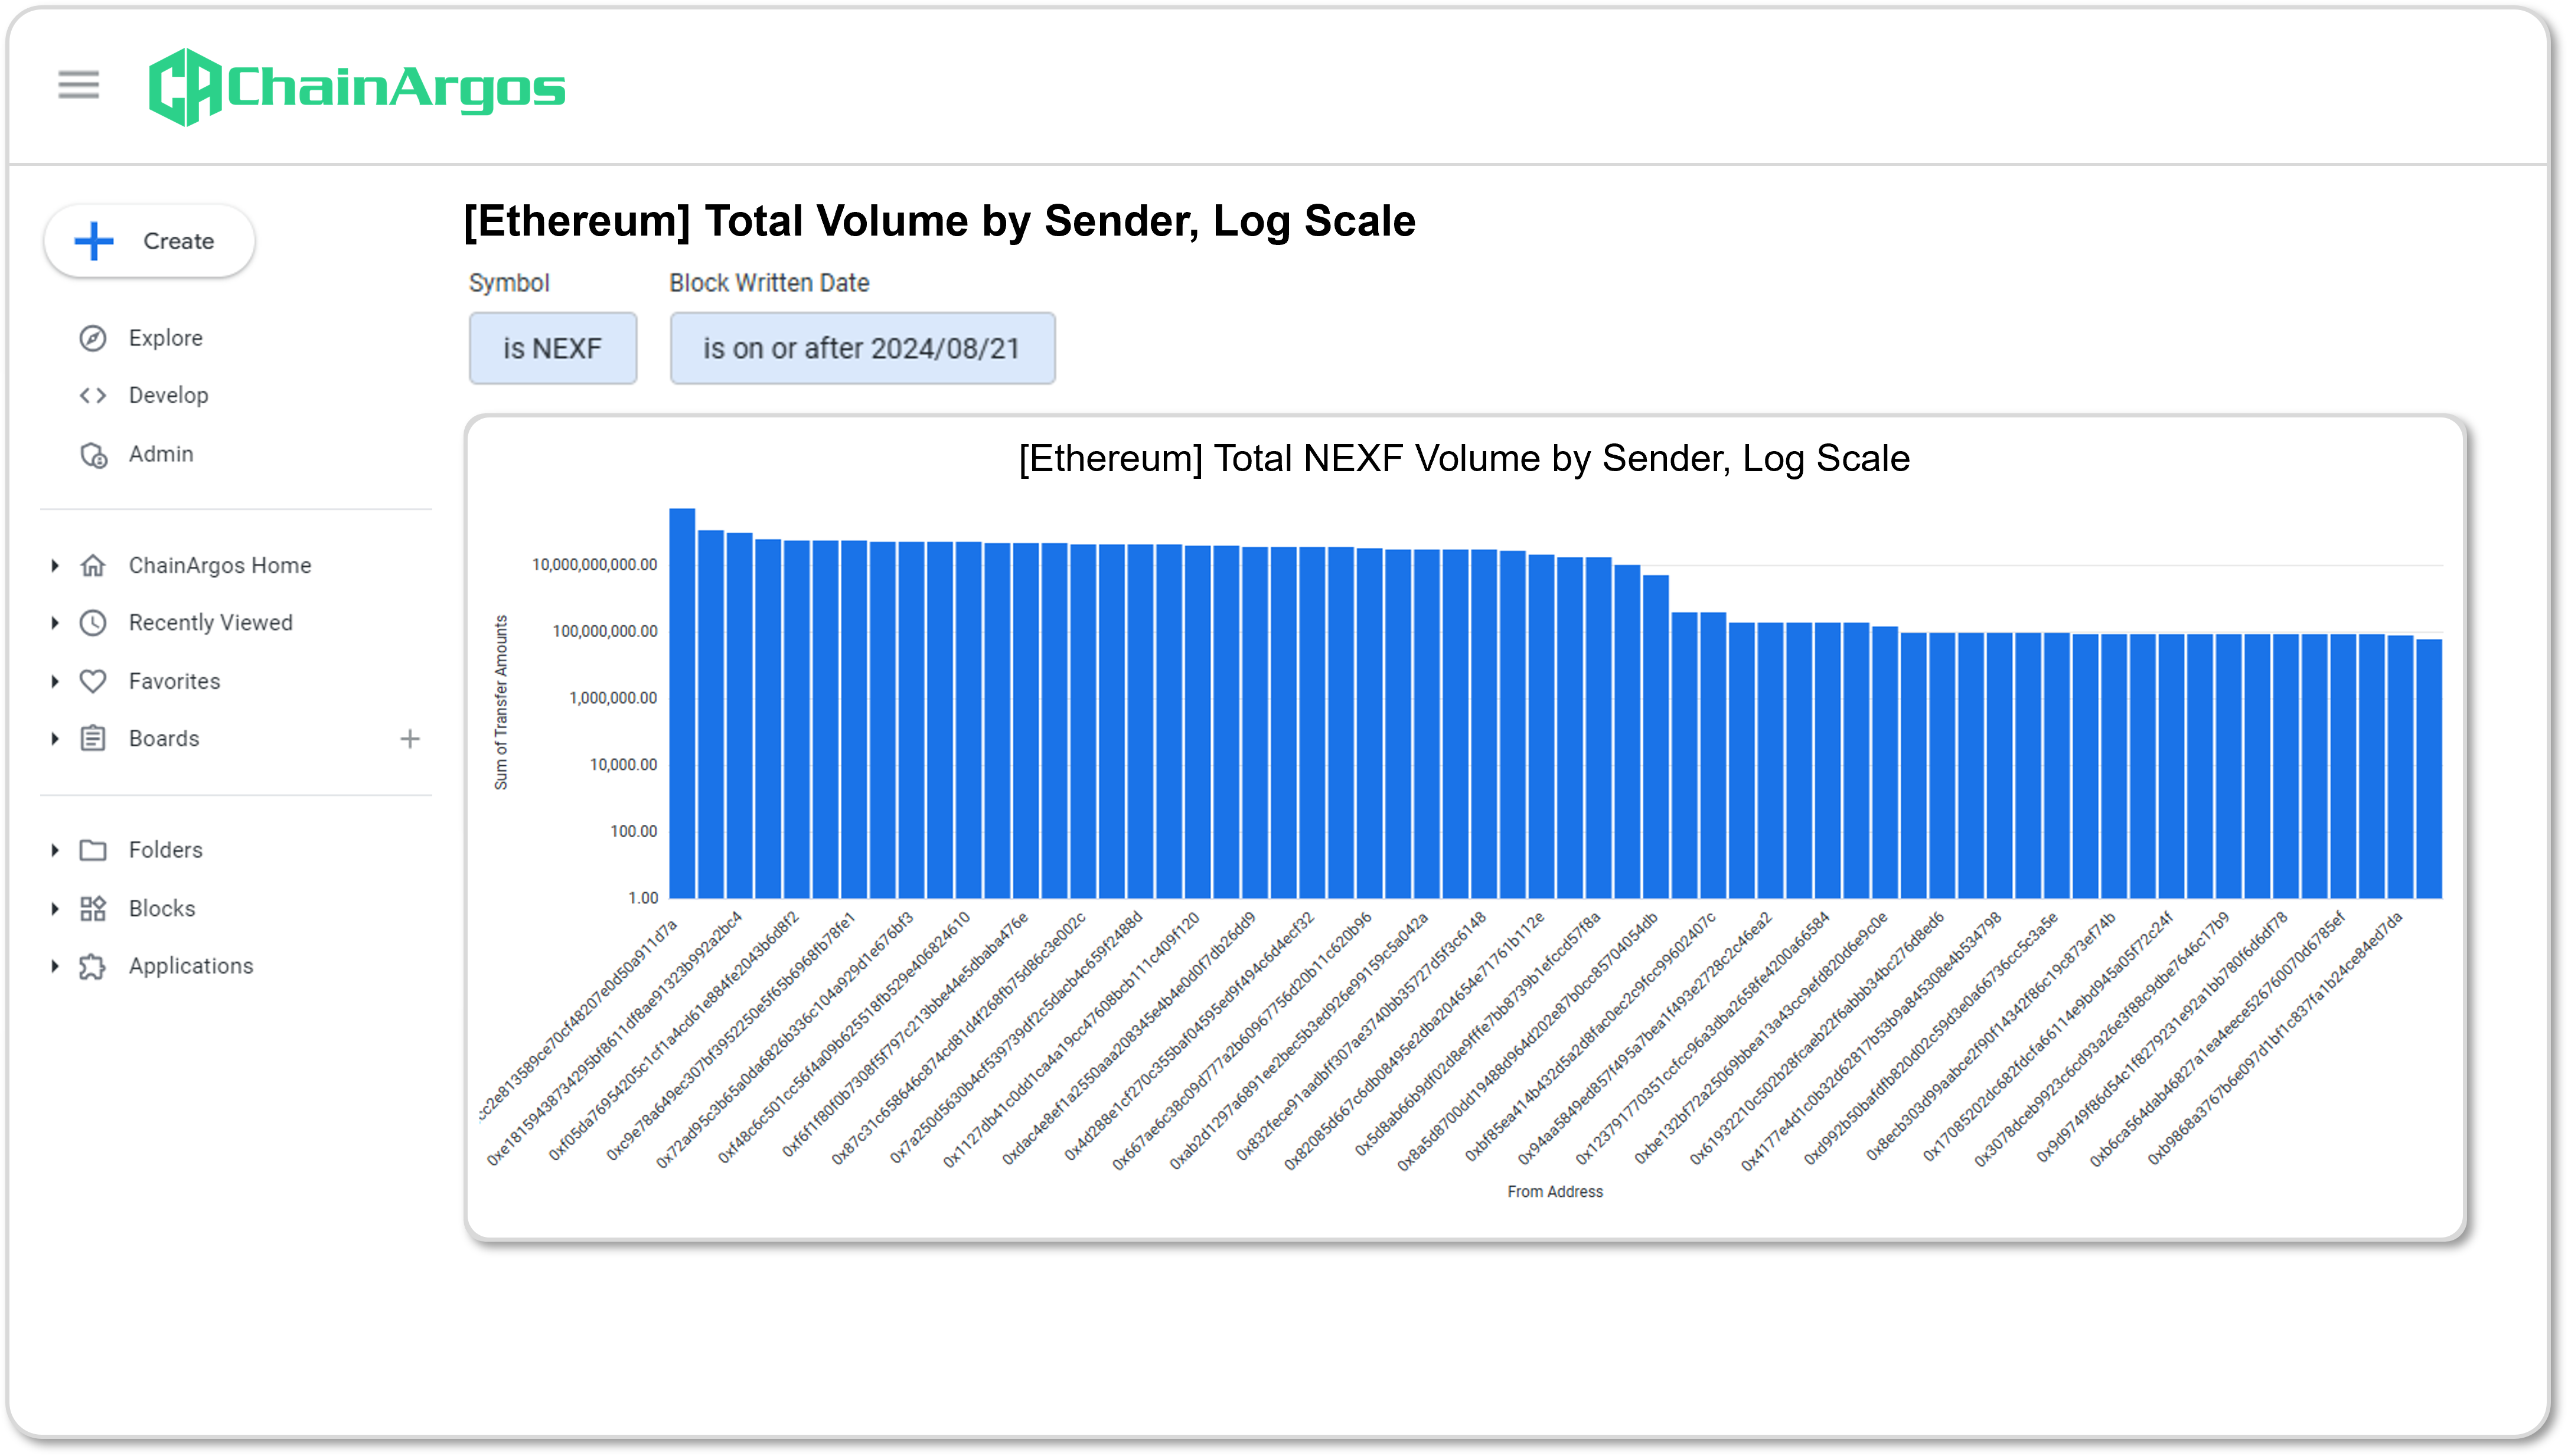
Figure 2. Total Volume by sender addresses (From Address) of the NEXF token on a Log Scale.
Using a log scale, it’s obvious the sender addresses (From Address) were sending approximately the same bucketed amounts of NEXF tokens, consistent with a uniform churn of tokens.
Logs scales are particularly useful because blockchain transaction data tends to cover several orders of magnitude.
In the case of NEXF, this is evident because you have a chunks of wallets sending roughly the same amounts of tokens at various levels, consistent with the “market makers” churning volume.
A log scale compresses the range, making it easier to visualize and compare the various volumes of all the different addresses, if this transaction activity was organic, you would expect to see far more randomness in the chart.
2.4 Looking at Various Time Frames
To round off our analysis, let’s look at both the weekly and daily Sum of Transfer Amounts of NEXF tokens by senders.
In Figure 3., we look at the weekly volumes of NEXF tokens by senders and some obvious patterns emerge.
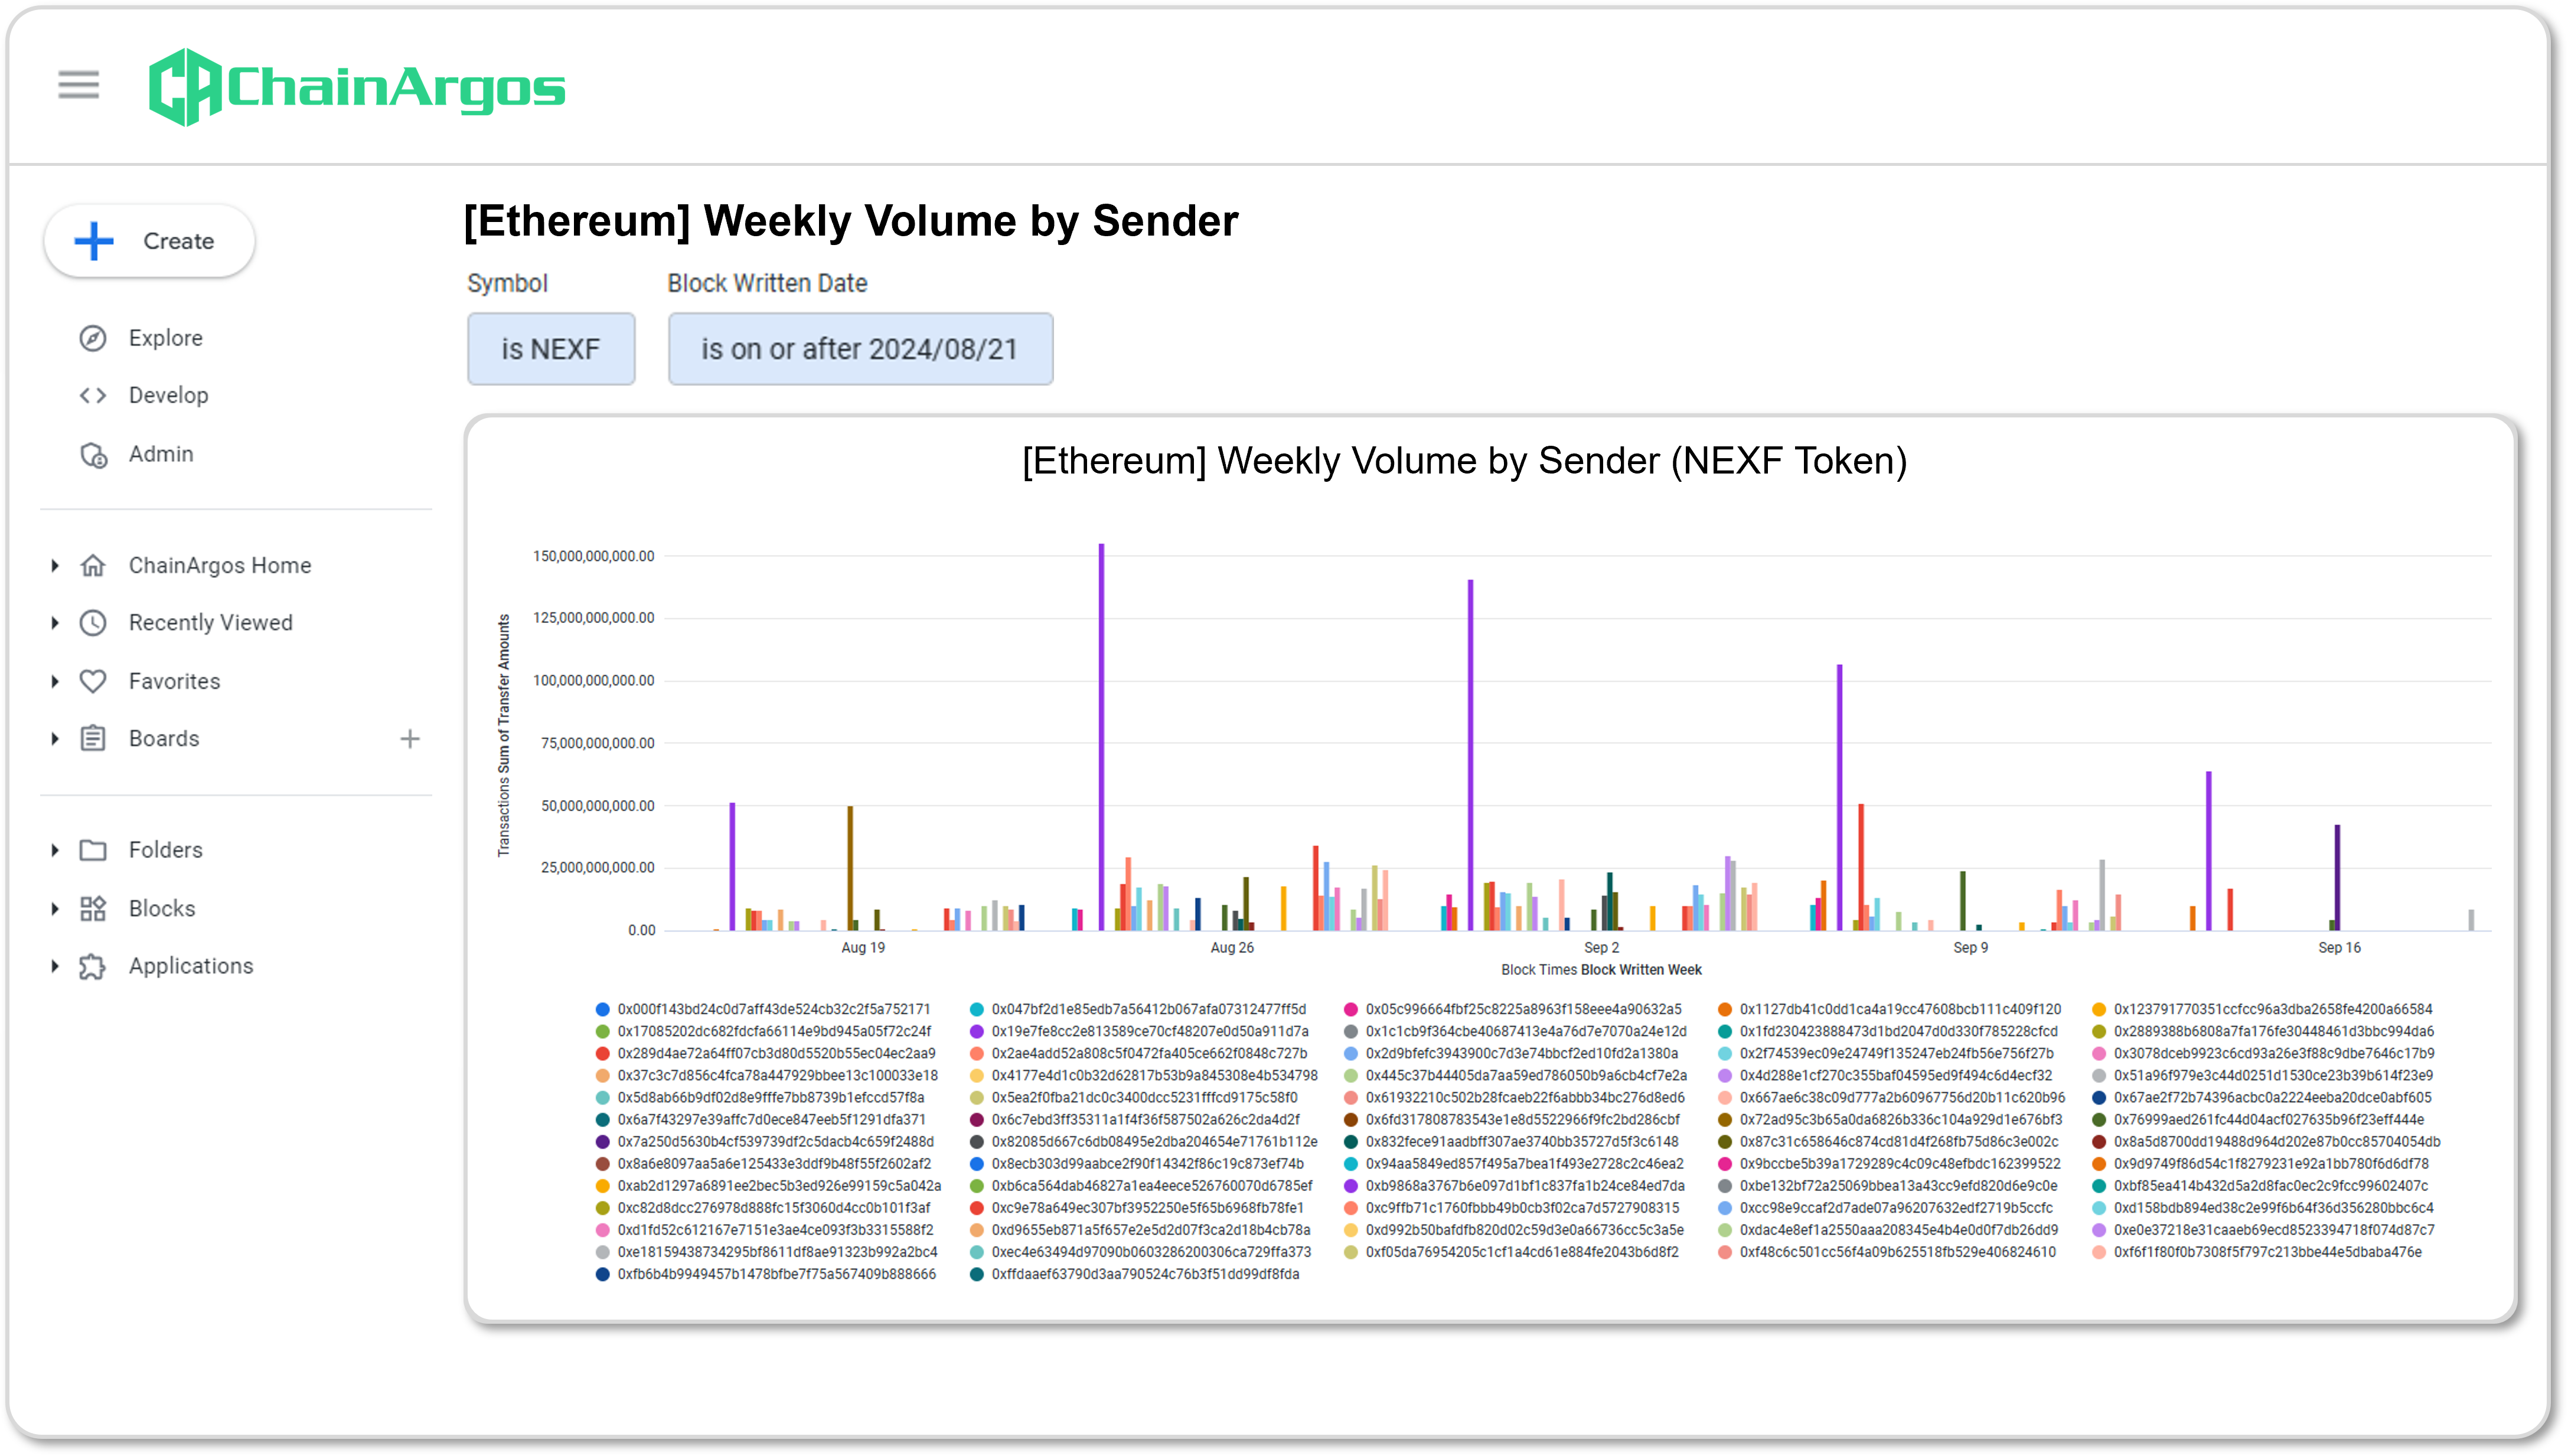
Figure 3. Weekly Volume by Sender of the NEXF token with the addresses in various colors plotted on the horizontal axis and the Sum of Transfer Amounts on the vertical axis.
The purple bar in Figure 3 is the NEXF Uniswap V2 Pool with contract address 0x19e7Fe8CC2E813589Ce70CF48207e0D50a911d7a (“NEXF Uniswap Pool”).
Notice the other senders of the NEXF token cluster mainly just below the 25 billion transfer mark and only exceed 50 billion tokens twice.
Observe the almost uniform distribution of NEXF tokens sent by the various addresses, consistent with unorganic transaction behavior.
In Figure 4. We look at the same data, only this time we use a daily scale.
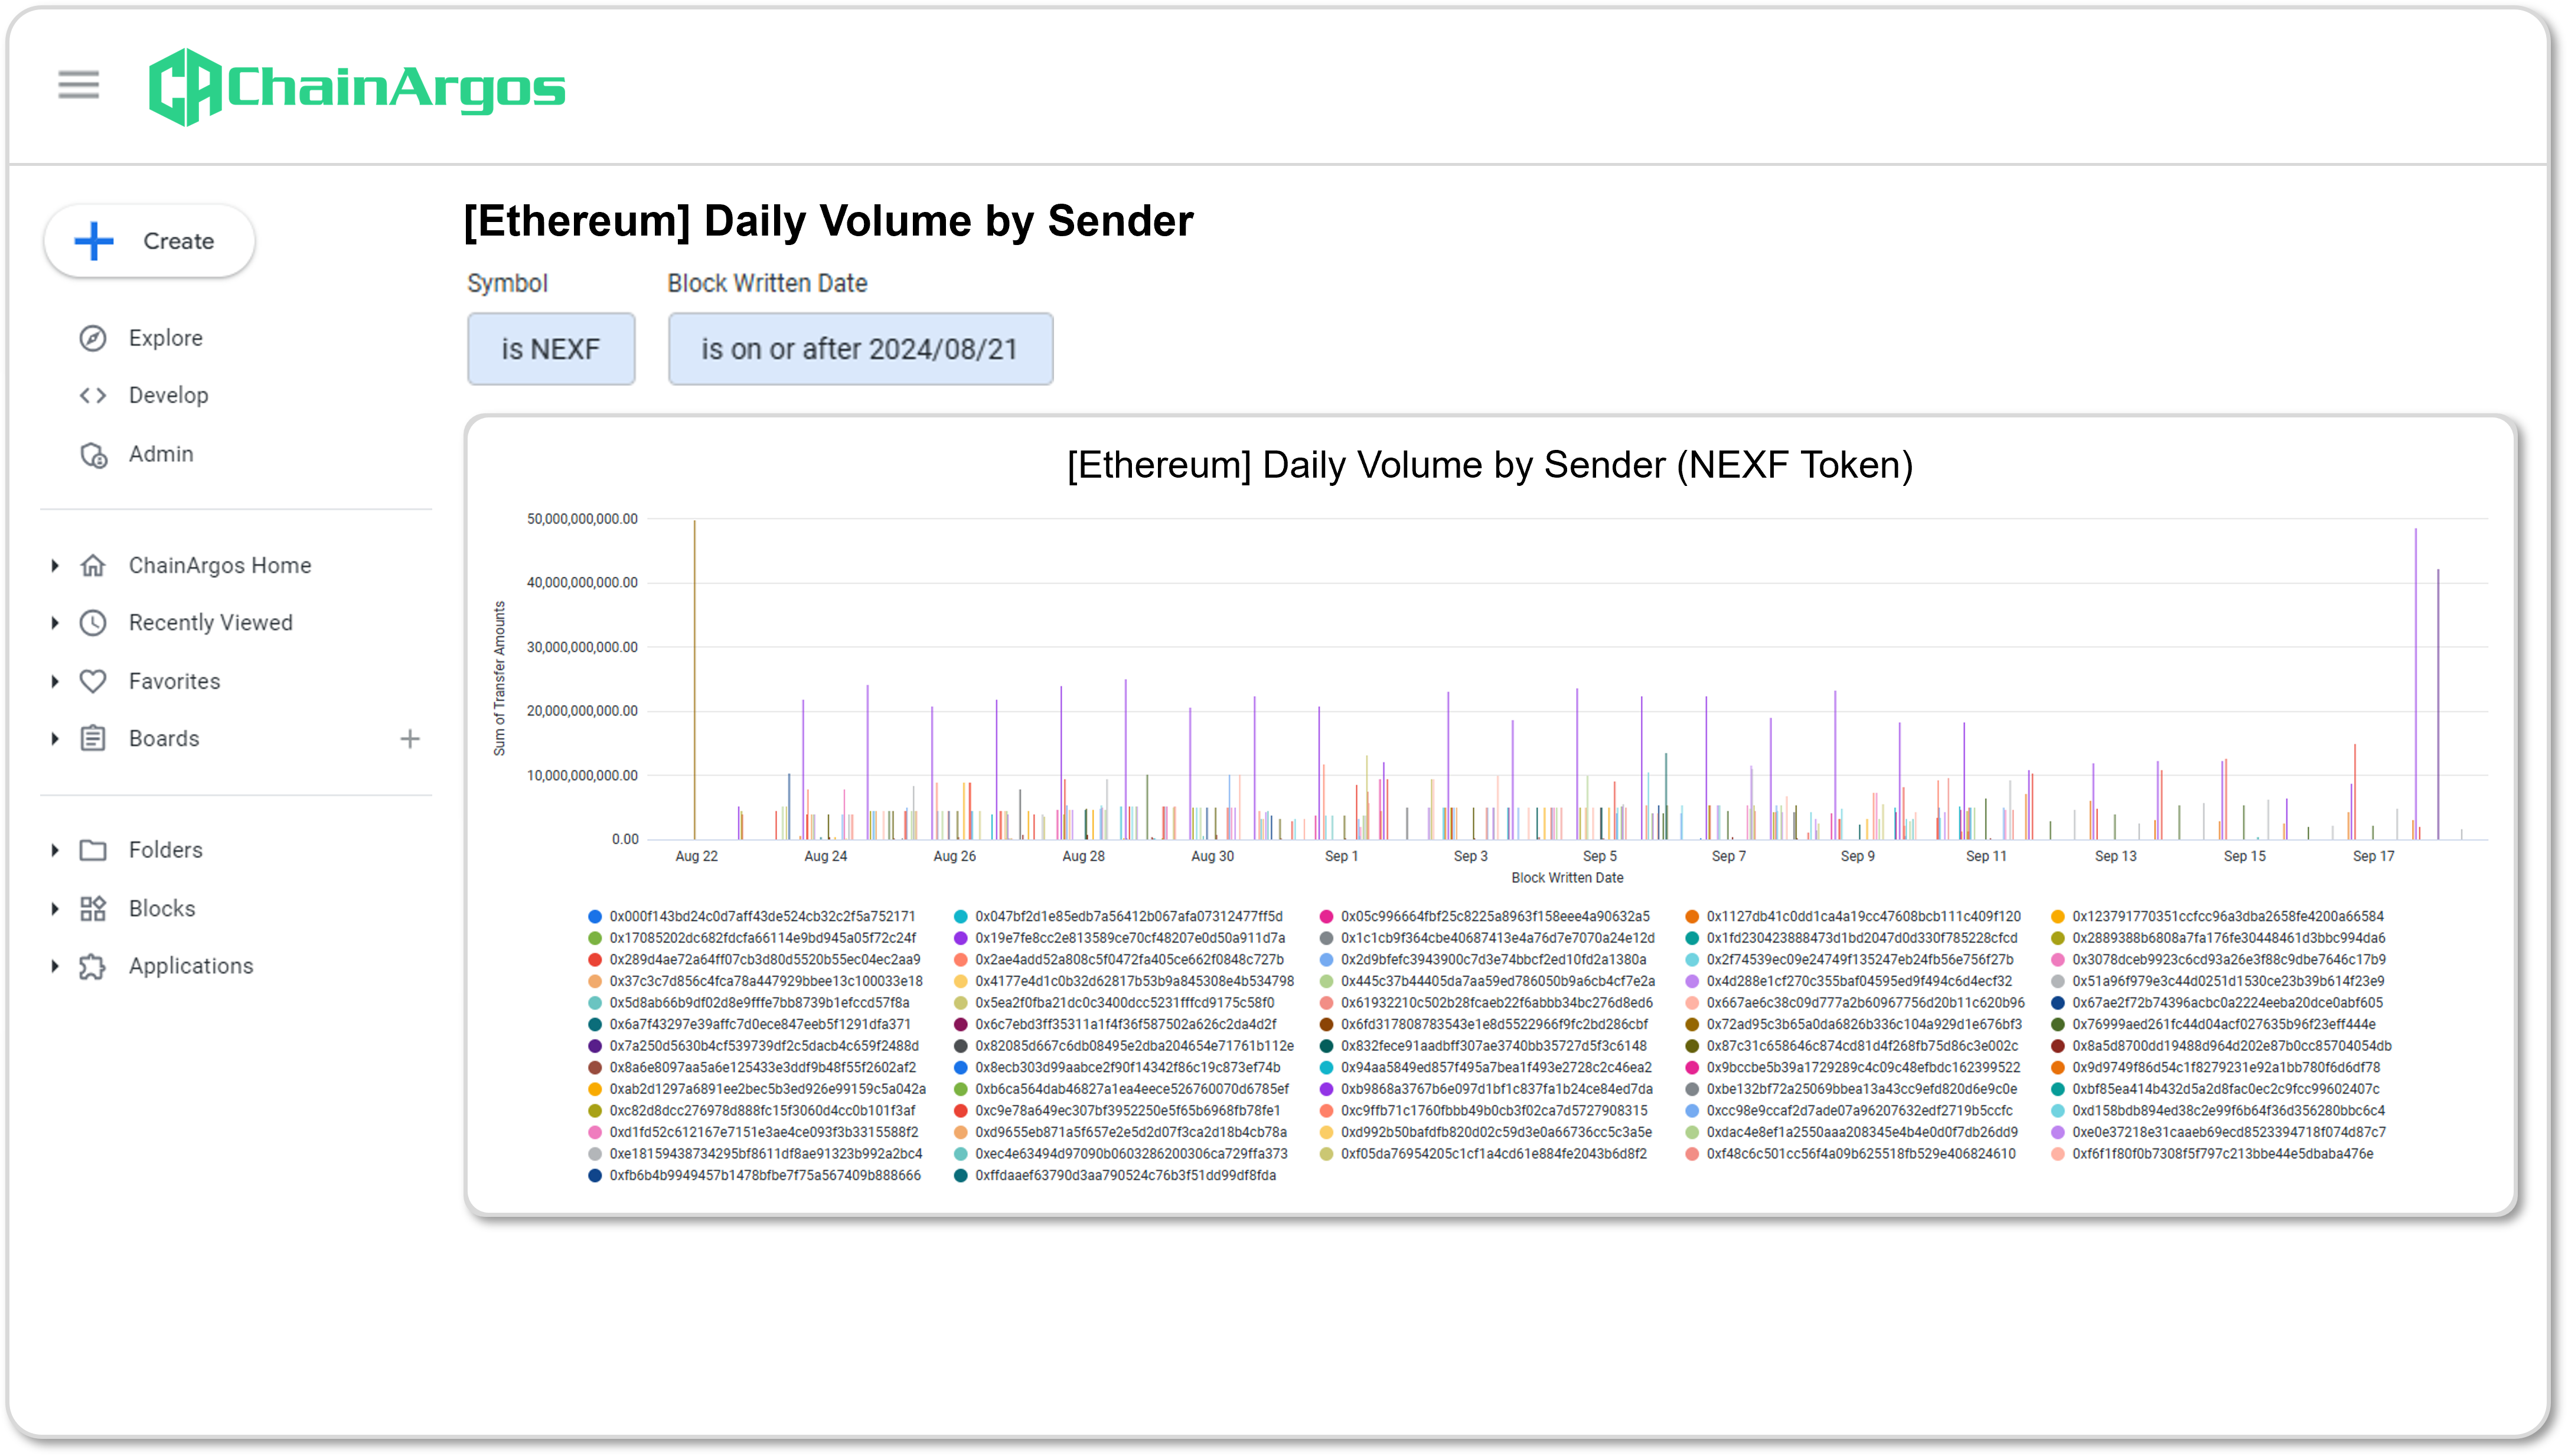
Figure 4. Daily Volume by Sender of the NEXF token with the addresses in various colors plotted on the horizontal axis and the Sum of Transfer Amounts on the vertical axis.
Again, notice how a clear pattern emerges for senders. Outside of the outliers, which are liquidity pools, the vast majority of senders of NEXF tokens cluster below what appear to be preset levels.
On average, almost all the other NEXF token-sending wallets hover around the 5 billion mark daily.
The “rhythm” of NEXF tokens being sent is also clear from the daily chart in Figure 4.
3. Lessons Learned
- Number of Unique Transactions
- Number of Unique Senders
- Number of Unique Receivers
- Sum of Transfer Amounts
- Log Scale